Evaluate whether a region can support the next opportunity.
zScale Intellect is the full-stack AI research platform for regional economic development. It brings project demand, workforce capacity, education pipelines, regional assets and incentives together in one view of your region and forecasts what comes next.
Built for economic development teams, site selectors, expanding companies and career institutes making regional growth decisions.
Free to explore. North Texas today, more regions coming.
 zScale Intellect
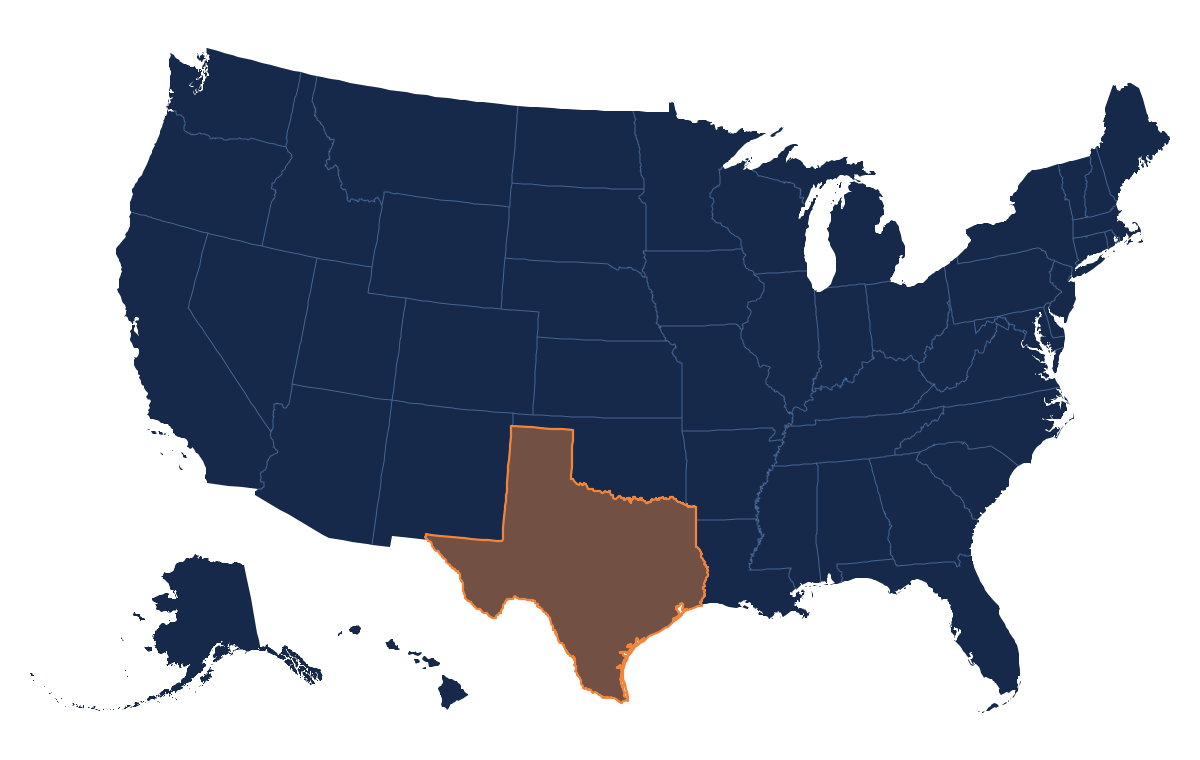
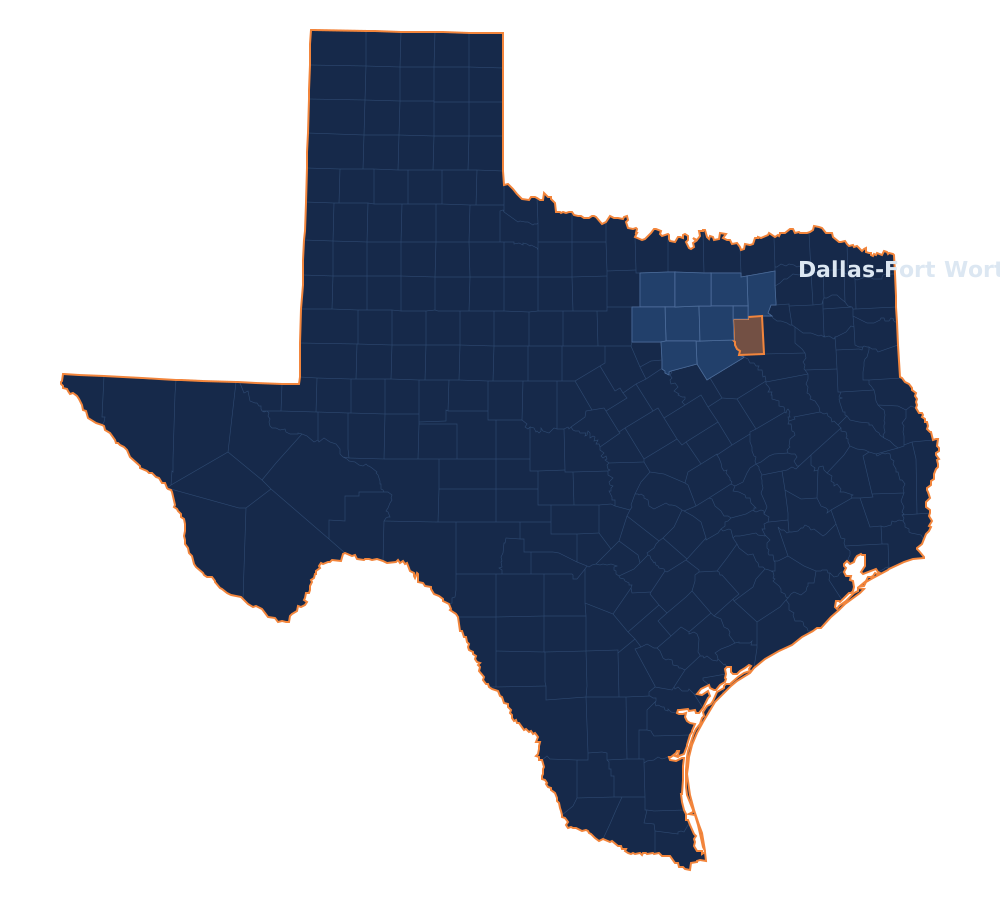
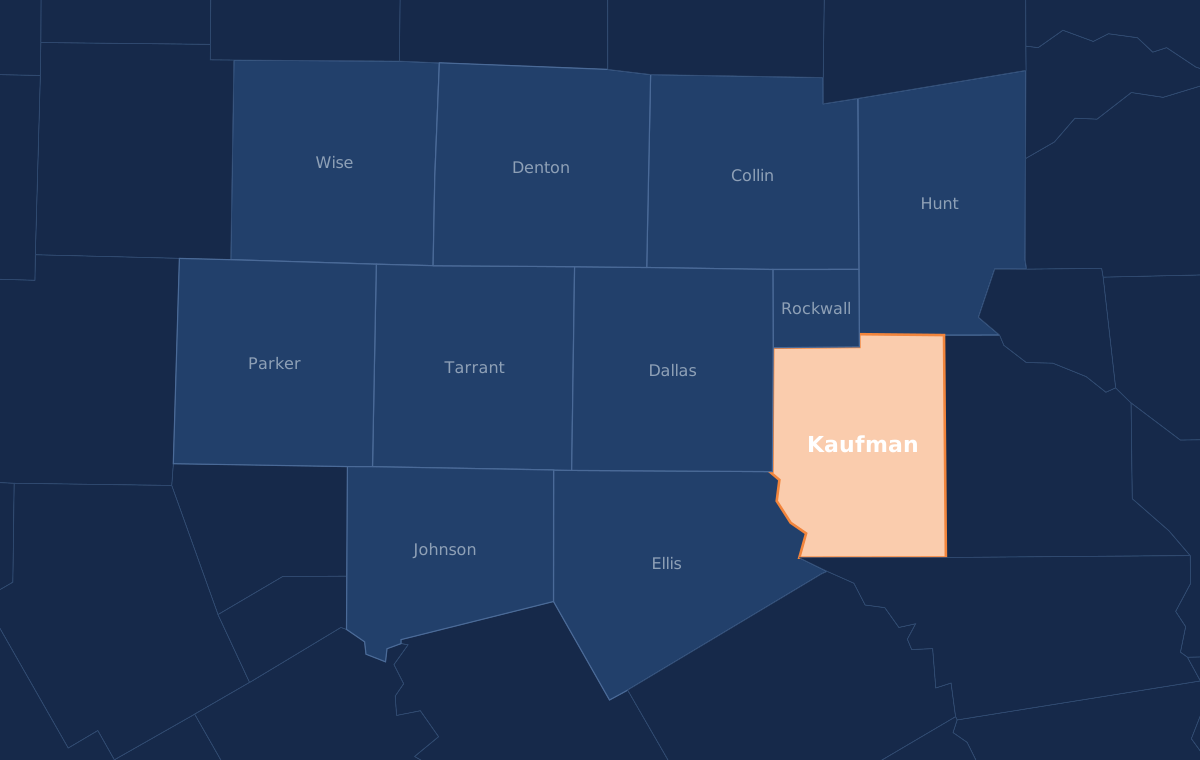
Example region: Kaufman County, Texas. Sources: BLS, Texas Workforce Commission, U.S. Census Bureau Vintage 2025, Dallas Fed.
REGIONAL SIGNALS ZSCALE INTELLECT IS TRACKING
Know what your region will need before the hiring starts.
zScale Intellect forecasts what your region will need next. It connects announced projects and their hiring timelines with the occupations, training programs and outside forecasts behind them, so your team can plan training, sites and incentives ahead of demand.
- Project pipeline. Announced projects mapped to the occupations and hiring dates they need.
- Forecasts with ranges. zScale and outside forecasts shown with their range, date and source.
- Labeled estimates. zScale figures are marked as ours and kept apart from published data.
Texas holds nine places on the two national county growth lists.
Why it matters: Texas is adding people faster than almost anywhere in the country. When a county grows this quickly, local leaders need to know where new residents will work, how they will get there, where they will train and whether the tax base can keep up. That is what zScale helps them answer.
U.S. Census Bureau, Vintage 2025 county estimates, released March 26, 2026 · Published
The full research stack for your region.
Each workspace gives you six views of your region, from the national picture down to a single site. You can connect a project with the people, sites and funding it needs, and see outside forecasts next to the published numbers so you can plan for what is likely to happen next.Scan your region free →How the platform works →
From the whole country to one city
Start with the national picture and zoom in step by step. At every level you see what the numbers say and where they came from.
Who lives within a commute
What people nearby do, what they earn and which schools are training the next hires.
Which industries are growing
Jobs added and lost by industry, new and closing businesses, and the programs that train for them.
What it costs to build here
The tax base, the tax rate, the roads and power that serve a site, and what a new facility would cost over ten years.
Projects that need the same people
When several new projects nearby need the same kinds of workers, you will see it early, before hiring starts.
Predictive analysis and forecasts
zScale forecasts of workforce demand, set beside outside forecasts with their ranges and dates, so you can plan for the likely outcome and the alternatives.
Check the six things every project needs before hiring starts.
A project succeeds when the people, the site and the funding are ready at the same time. For each of the six areas below, zScale shows what is already known, what still needs to be checked and who can confirm it, so everyone involved knows the next step.
Roles, wages, qualifications and hiring dates
Suppliers, processes and free capacity
Space, utilities, permits and timing
Seats, instructors and accepted credentials
Transport, childcare and onboarding
Allowable costs, match and deadlines
Built for teams that need answers but don't have a research department.
Fast-growing communities preparing for prospects, site visits and board meetings.
Consultants comparing candidate regions on labor shed, wages, costs and competing projects.
Family-owned and mid-sized firms checking whether a new location can staff their growth.
Schools and training providers matching programs to the employers hiring nearby.
A 90-day pilot covers one region and up to five questions.
It includes one workspace, a written evaluation and three working sessions. The zScale team scopes each pilot to the region and the questions, then sends a proposal.
Analysis published every other Thursday.
Regional evaluation, explained.
Short answers to the questions buyers and AI search tools ask most.
What is regional evaluation?
Regional evaluation measures whether a region can support a project or an industry. It combines jobs, commuting patterns, wages, colleges and training, the local tax base and announced projects, with each figure tied to its public source and release date.
Where does zScale Intellect get its data?
From public sources: the Bureau of Labor Statistics, the U.S. Census Bureau, the Texas Workforce Commission, the Federal Reserve Bank of Dallas, the Texas Comptroller, IPEDS and O*NET. Key indicators are checked every week for new releases.
Which regions are covered?
North Texas is available now, starting with Dallas-Fort Worth. The method applies to any U.S. region, and the zScale team can tell you what is available for yours.
Who uses zScale Intellect?
Economic development organizations without an in-house research team, site selection consultants, expanding companies and career institutes.
Do we need to share confidential information?
No. Workspaces start from public data. Projects you add stay private to your workspace.
How does a pilot work?
A 90-day pilot covers one region and up to five questions, with a written evaluation and three working sessions. Contact the zScale team for a proposal.
What does zScale Intellect do?
zScale Intellect is the full-stack AI research platform for regional economic development. Each workspace gives your team the full research stack for one region: labor market and workforce data, industries and employers, colleges and training programs, sites and the tax base, announced projects and outside forecasts. Every figure carries its source, release date and a label that says what kind of figure it is.
Does zScale Intellect include forecasting?
Yes. zScale Intellect forecasts workforce demand for your region by connecting announced projects with the occupations and hiring dates they need. Workspaces also show outside forecasts, such as the Dallas Fed forecast for Texas jobs, with their range and date. zScale forecasts are labeled as ours and kept separate from published data.
How is zScale Intellect different from a labor market data tool?
Labor market data tools focus on jobs, wages and occupations. zScale Intellect starts from a decision your team needs to make and brings labor market data together with projects, sites, training, incentives and forecasts for that region. Each figure is labeled as published, calculated, estimate, forecast or zScale reading, so readers can see where it came from.
Is there a free version?
Yes. The free Region Scan shows jobs, leading occupations, employer updates and colleges for selected North Texas counties and Dallas-Fort Worth cities, with the source and as-of date for each number.